How to Know if a Sale Price Is Actually Good?
Most Discounts Are Marketing. Price History Is Data.
If you've spent any time shopping online, you've probably seen products advertised as 30%, 50%, or even 70% off. Large discount percentages are everywhere, especially on marketplaces with millions of products.
The problem is that a discount percentage alone doesn't tell you whether you're actually getting a good deal.
Over the past few years, while building Vemexo, I've analyzed pricing data for more than 183,000 AliExpress products. At any given time, we actively track around 68,000 products across hundreds of categories, updating prices every three days and storing historical pricing information for long-term analysis.
One thing became obvious very quickly: many products are technically "on sale" all the time.
Their displayed discount changes, the crossed-out price changes, and the promotional labels change, but the actual selling price remains almost the same.
That's why I stopped paying attention to advertised discount percentages and started focusing on price history instead.
Why Advertised Discounts Can Be Misleading
Most shoppers already have a healthy level of skepticism toward promotional badges such as:
- 50% OFF
- Flash Sale
- Limited Time Deal
- Lowest Price
- Special Offer
Yet these promotions continue to exist because they still influence buying decisions.
The issue is that the advertised discount is usually calculated against a reference price chosen by the seller. That reference price may not reflect what customers were actually paying over the previous weeks.
As a result, a product can appear heavily discounted while its real market price has barely changed.
When evaluating a deal, I completely ignore the seller's advertised discount percentage. Instead, I compare the current price with historical prices.
Data tells the truth. Marketing does not always do that.
The First Thing I Look At
When reviewing products on Vemexo, the most important comparison is the current price versus the average price over the previous 30 days.
A small difference usually doesn't mean much. Prices naturally fluctuate.
In my experience, a discount starts becoming interesting when the current price is approximately 10% to 20% below its recent average.
Anything smaller is often just normal pricing noise.
This approach is the foundation of Vemexo's Deal Score, which measures how attractive a current price is compared to historical pricing data.
Instead of asking:
"How large is the advertised discount?"
I ask:
"How unusual is the current price compared to what buyers have actually been paying recently?"
Those are very different questions.
Why Price Alone Doesn't Tell the Whole Story
One of the most surprising things I learned from analyzing thousands of products is that price changes and demand often move together.
Looking only at price can lead to incorrect conclusions.
That's why I also pay attention to order volume.
A product reaching its lowest price in 30 days does not automatically make it a great deal.
If demand continues falling despite the lower price, that may indicate buyers are simply losing interest in the product.
On the other hand, when a lower price is accompanied by rising demand, that can be a much stronger signal that the offer is genuinely attractive.
Price explains part of the story.
Demand explains the rest.
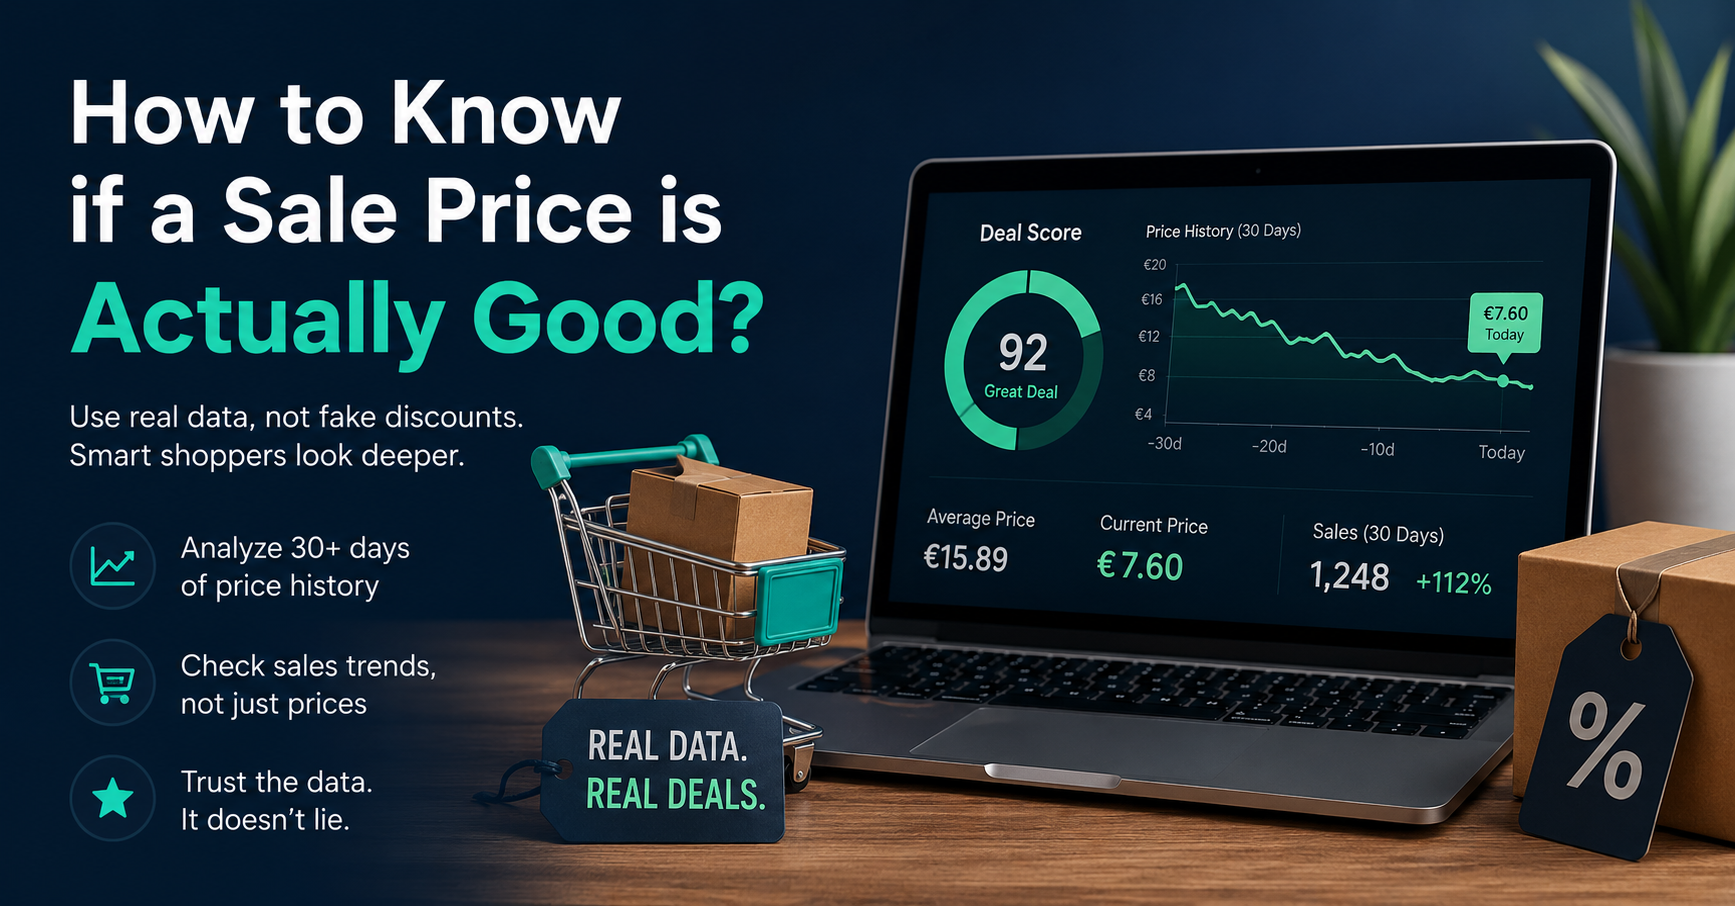
A Real Example: Lower Price, Lower Demand
One example from Vemexo's historical data involved a product called Titanium Step Drill Bit Set for Wood and Metal.
The product originally sold for approximately €16.
As sales slowed down, the price dropped to around €10.
At first glance, that looked like a significant discount.
However, demand did not recover.
Sales activity remained weak, and by the end of the month the price had fallen even further to approximately €7.60.
This is an interesting case because the lower price alone did not indicate a strong buying opportunity.
The falling demand suggested the market simply wasn't interested in the product anymore.
Without historical context, many shoppers would have seen the first price drop and assumed it was an exceptional deal.
The data told a different story.
A Real Example: Lower Price, Higher Demand
Another product showed the opposite pattern.
The U-Shaped Tortoiseshell Acetate Hair Fork for Women experienced gradual price reductions throughout the month.
At the same time, order volume steadily increased.
By the end of the period, sales had roughly doubled.
This is exactly the kind of behavior I like to see.
Buyers responded positively to the lower price, and demand increased as a result.
The combination of a declining price and growing sales created a much stronger signal than either metric could provide on its own.
What I Learned From Tracking Thousands of Products
After analyzing pricing behavior across tens of thousands of products, several patterns appear repeatedly:
- Many products remain permanently "on sale."
- Advertised discount percentages are often poor indicators of actual value.
- Historical price data is more useful than promotional labels.
- Discounts become more interesting when they are significantly below recent average prices.
- Demand trends provide important context that price alone cannot reveal.
- A product's lowest price is not automatically its best buying opportunity.
The biggest mistake shoppers make is evaluating a deal based on what the seller says instead of what the data says.
For example, our list of best-selling earbuds on AliExpress shows how strong demand can help identify products that continue attracting buyers even as prices change.
The Simple Rule I Follow
Whenever I evaluate a product, I ignore the promotional language and ask three simple questions:
- How does the current price compare to the average price over the last 30 days?
- Is the discount large enough to matter?
- What happened to demand while the price changed?
Those answers are usually more valuable than any banner, badge, or percentage displayed on the product page.
Final Thoughts
If there's one thing I've learned from tracking hundreds of thousands of products, it's this:
Trust the data.
Price history doesn't care about marketing campaigns, promotional graphics, or flashy discount percentages. It simply shows what buyers have actually been paying.
That's why Vemexo uses a Deal Score based on historical pricing data rather than seller-provided discount claims.
A good sale price isn't the one with the biggest advertised discount.
A good sale price is the one that is genuinely low compared to its recent history.